Tracing#
time expected: 8 minutes
This guide dives into the tracing capabilities that BentoML offers.
BentoML allows user to export trace with Zipkin, Jaeger and OTLP. This guide will also provide a simple example of how to use BentoML tracing with Jaeger
Why do you need this?#
Debugging models and services in production is hard. Adding logs and identifying the root cause of the problem is time consuming and error prone. Additionally, tracking logs across multiple services is difficult, which takes a lot of time, and slow down your development agility. As a result, logs won’t always provide the required information to solve regressions.
Tracing encompasses a much wider, continuous view of an application. The goal of tracing is to following a program’s flow and data progression. As such, there is a lot more information at play; tracing can be a lot noisier than logging – and that’s intentional.
BentoML comes with built-in tracing support, with OpenTelemetry. This means users can then use any of the OpenTelemetry compatible tracing tools to visualize and analyze the traces.
Running a BentoService#
Requirements: bentoml must be installed with the extras dependencies for tracing exporters. The following command will install BentoML with its coresponding tracing exporter:
pip install "bentoml[tracing-jaeger]"
pip install "bentoml[tracing-zipkin]"
pip install "bentoml[tracing-otlp]"
We will be using the example from the quickstart.
Run the Jaeger all-in-one docker image:
» docker run -d --name jaeger \
   -e COLLECTOR_ZIPKIN_HOST_PORT=:9411 \
   -e COLLECTOR_OTLP_ENABLED=true \
   -p 6831:6831/udp \
   -p 6832:6832/udp \
   -p 5778:5778 \
   -p 16686:16686 \
   -p 4317:4317 \
   -p 4318:4318 \
   -p 14250:14250 \
   -p 14268:14268 \
   -p 14269:14269 \
   -p 9411:9411 \
   jaegertracing/all-in-one:1.38
For our Mac users
If you are running into this error:
2022-10-05T01:32:21-0700 [WARNING] [api_server:iris_classifier:8] Data exceeds the max UDP packet size; size 216659, max 65000
2022-10-05T01:32:24-0700 [ERROR] [api_server:iris_classifier:3] Exception while exporting Span batch.
Traceback (most recent call last):
  File "~/venv/lib/python3.10/site-packages/opentelemetry/sdk/trace/export/__init__.py", line 367, in _export_batch
    self.span_exporter.export(self.spans_list[:idx])  # exporter_type: ignore
  File "~/venv/lib/python3.10/site-packages/opentelemetry/exporter/jaeger/thrift/__init__.py", line 219, in export
    self._agent_client.emit(batch)
  File "~/venv/lib/python3.10/site-packages/opentelemetry/exporter/jaeger/thrift/send.py", line 95, in emit
    udp_socket.sendto(buff, self.address)
OSError: [Errno 40] Message too long
This is because the default UDP packet size on Mac is set 9216 bytes, which is described under Jaeger reporters. To increase the UDP packet size, run the following command:
% sysctl net.inet.udp.maxdgram
# net.inet.udp.maxdgram: 9216
% sudo sysctl net.inet.udp.maxdgram=65536
# net.inet.udp.maxdgram: 9216 -> 65536
% sudo sysctl net.inet.udp.maxdgram
# net.inet.udp.maxdgram: 65536
To configure Jaeger exporter, user can provide a config YAML file specifying the tracer type and tracing server information under api_server.tracing:
Provide this configuration via environment variable BENTOML_CONFIG to bentoml serve:
» BENTOML_CONFIG=bentoml_configuration.yaml bentoml serve iris_classifier:latest
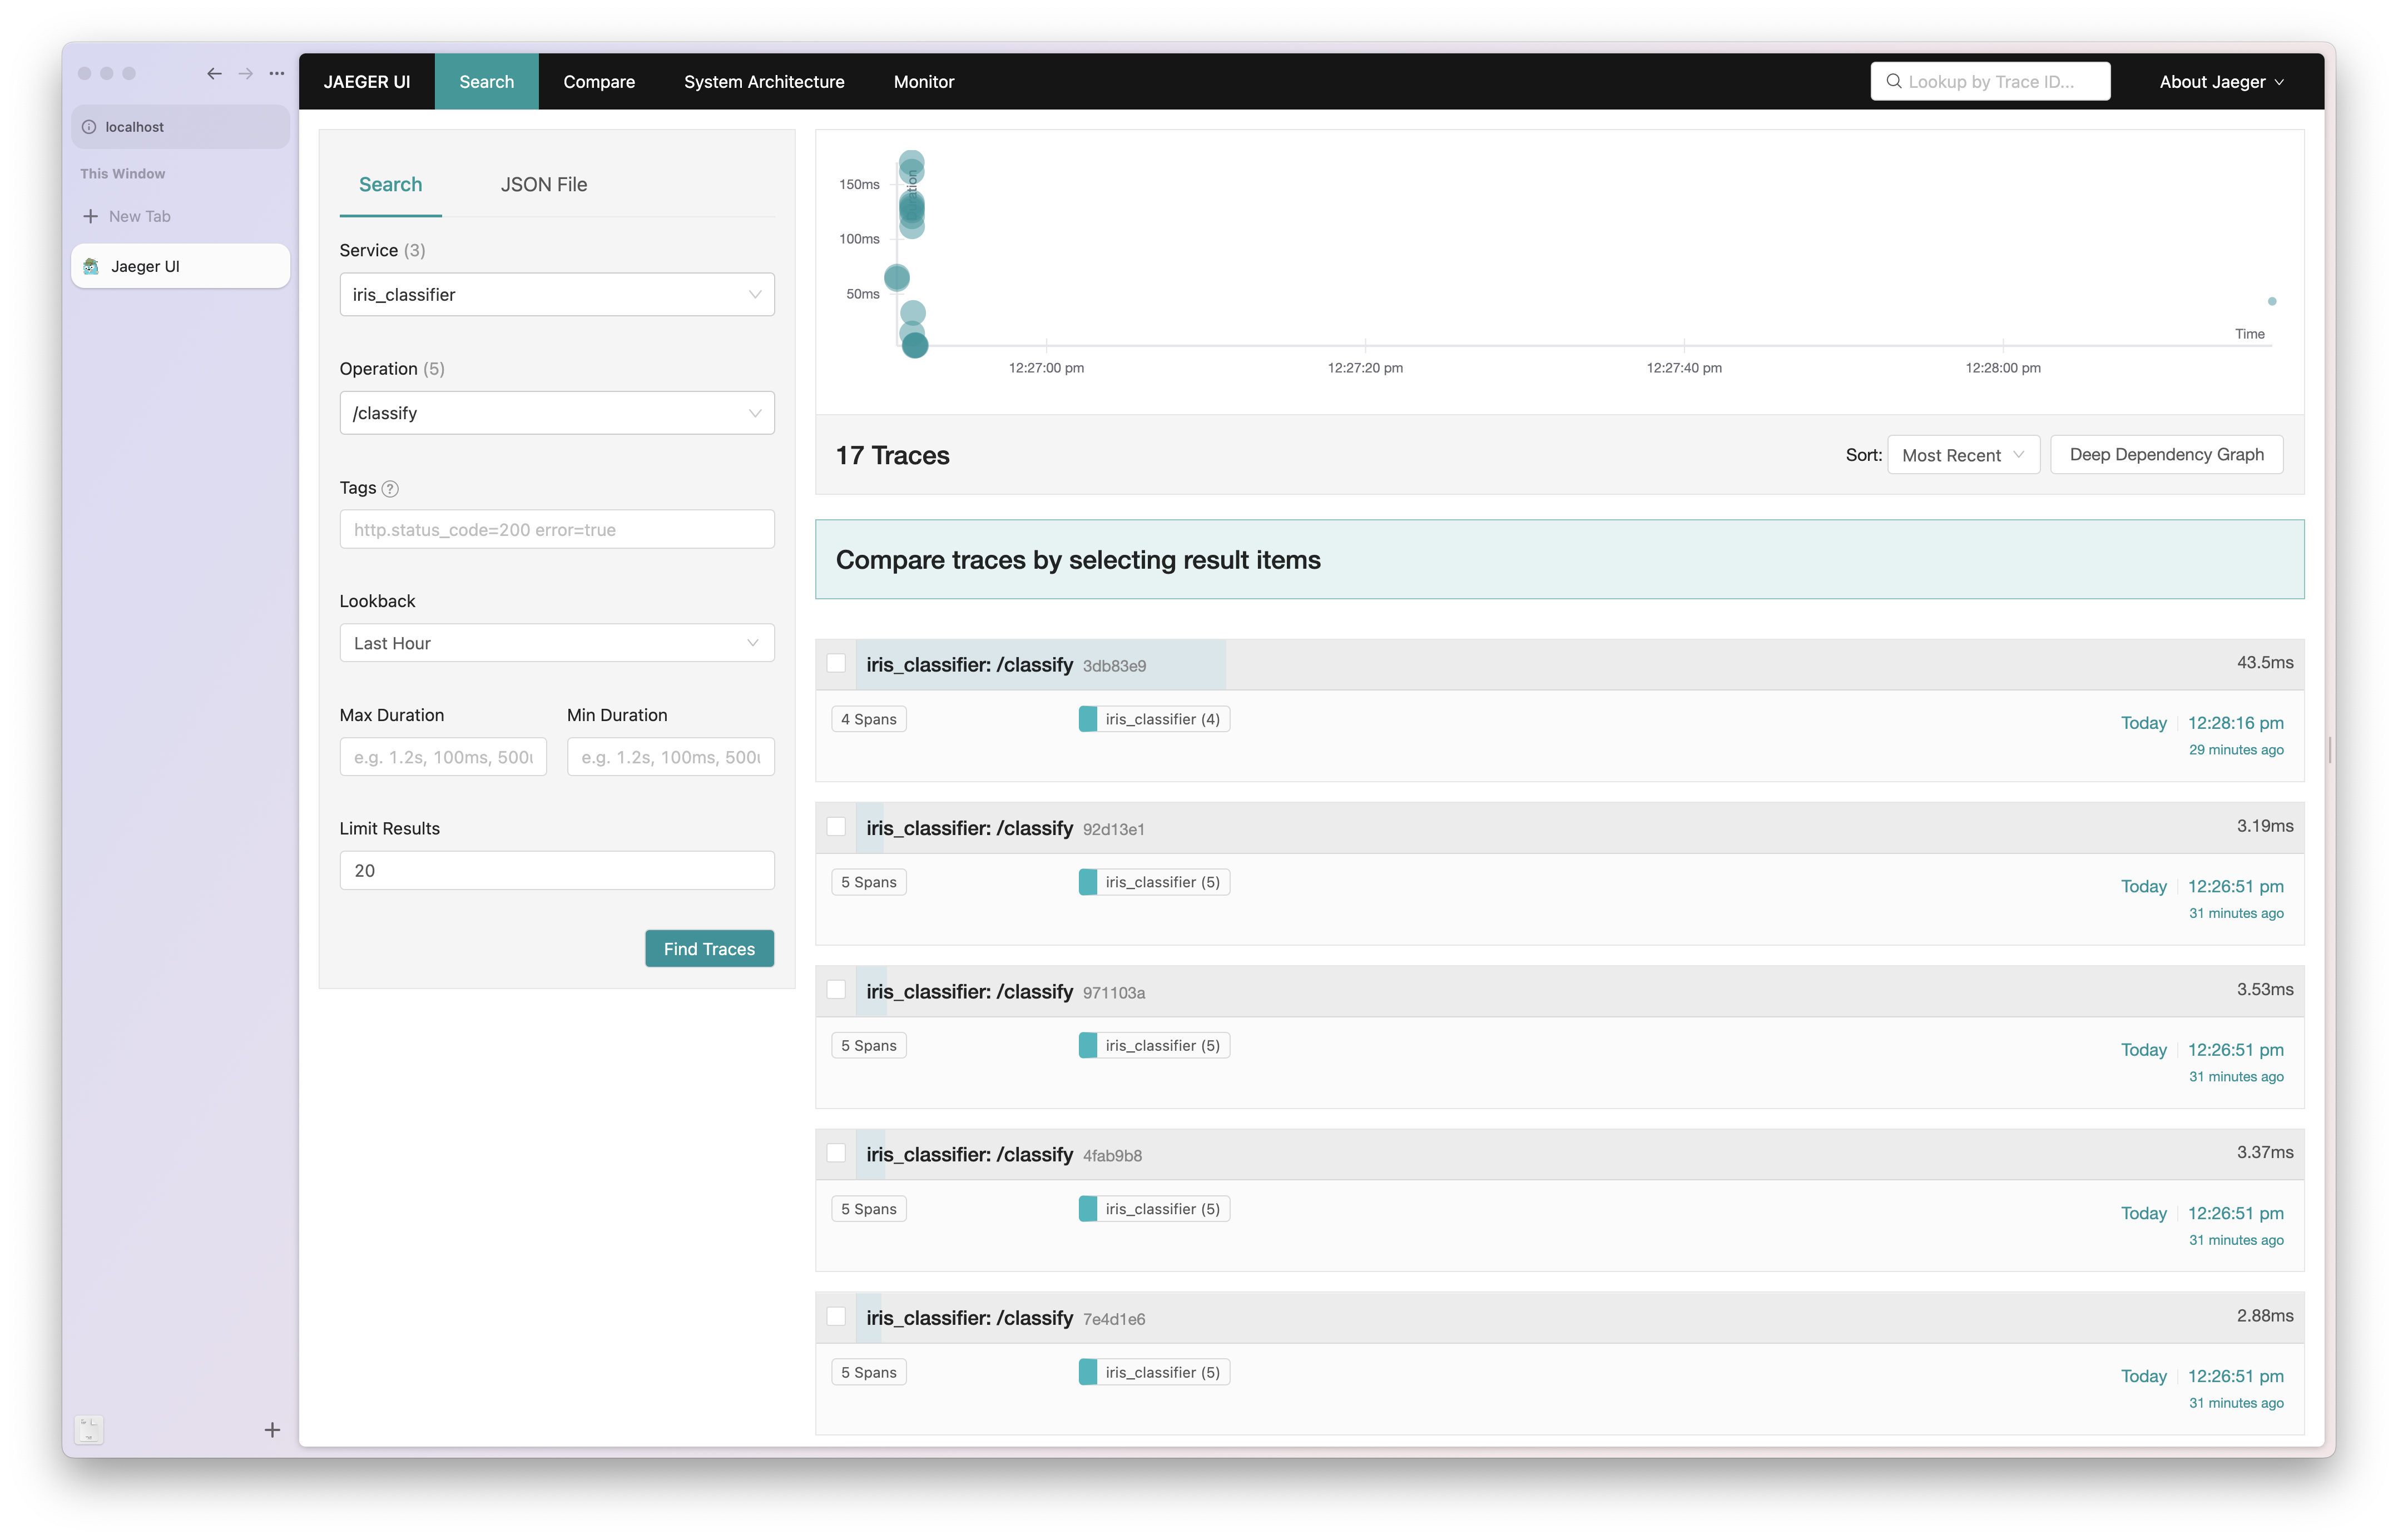
Send any request to the BentoService, and then you can visit the Jaeger UI to see the traces.
Tracing your containerized BentoService#
If you are running your BentoService within a container, you can use the following docker-compose configuration to run Jaeger and your BentoService together:
version: "3.7"
services:
  jaeger:
    image: jaegertracing/all-in-one:1.38
    ports:
      - "6831:6831/udp"
      - "16686:16686"
      - "14268:14268"
      - "5778:5778"
      - "4317:4317"
      - "4318:4318"
    networks:
      - jaeger-network
    environment:
      - COLLECTOR_OTLP_ENABLED=true
  iris_classifier:
    image: iris_classifier:klncyjcfqwldtgxi
    volumes:
      - ./bentoml_configuration.yaml:/home/bentoml/bentoml_configuration.yaml
    ports:
      - "3000:3000"
      - "3001:3001"
    command: ["serve-grpc"]
    environment:
      - OTEL_EXPORTER_JAEGER_AGENT_HOST=jaeger
      - OTEL_EXPORTER_JAEGER_AGENT_PORT=6831
      - BENTOML_CONFIG=/home/bentoml/bentoml_configuration.yaml
    networks:
      - jaeger-network
    depends_on:
      - jaeger

networks:
  jaeger-network:
Start the services with docker-compose -f ./docker-compose.yml up
To shutdown the services, run docker-compose -f ./docker-compose.yml down
Exporter Configuration#
Note
BentoML implements OpenTelemetry APIs, which means OpenTelemetry environment variables will take precedence over the configuration file.
For example, if you have the following configuration in your config file:
tracing:
    exporter_type: jaeger
    sample_rate: 1.0
    jaeger:
    protocol: thrift
    thrift:
        agent_host_name: localhost
Then environment variable OTEL_EXPORTER_JAEGER_AGENT_HOST will take precedence over the
agent_host_name setting in the config file.
The following section describes the configuration options for each tracing exporter.
By default, no traces will be collected. Set sample_rate to your desired fraction in order to start collecting them:
tracing:
  exporter_type: zipkin
  sample_rate: 1.0
If you would like to exclude some routes from tracing, you can specify them using
the excluded_urls parameter. This parameter can be either a comma-separated
string of routes, or a list of strings.
tracing:
  exporter_type: jaeger
  sample_rate: 1.0
  jaeger:
    address: localhost
    port: 6831
  excluded_urls: readyz,livez,healthz,static_content,docs,metrics
To set a timeout for the exporter, where it will wait for each batch export, use the timeout parameter:
tracing:
  exporter_type: jaeger
  sample_rate: 1.0
  timeout: 5 [#default_timeout]_
To set a maximum length string attribute values can have, use the max_tag_value_length parameter:
tracing:
  exporter_type: jaeger
  sample_rate: 1.0
  max_tag_value_length: 256
Note
All of the above value are shared values among the exporters. This means it will be
applied to corresponding exporter that is set via exporter_type.
Zipkin#
When using Zipkin, BentoML only supports its V2 protocol. If you are reporting to
the an OpenZipkin server directly, make sure to add the URL path /api/v2/spans
to the server address.
Configuration fields are passed through the OpenTelemetry Zipkin exporter [1].
tracing:
  exporter_type: zipkin
  sample_rate: 1.0
  zipkin:
    endpoint: http://localhost:9411/api/v2/spans
    local_node_ipv4: "192.168.0.1"
    local_node_ipv6: "2001:db8::c001"
    local_node_port: 31313
Jaeger#
The Jaeger exporter supports sending trace over both the Thrift and gRPC protocol. By default, BentoML will use the Thrift protocol.
Note
When it is not feasible to deploy Jaeger Agent next to the application, for example, when the application code is running as Lambda function, a collector can be configured to send spans using Thrift over HTTP. If both agent and collector are configured, the exporter sends traces only to the collector to eliminate the duplicate entries. [2].
To setup the collector endpoint that will be used to receive either Thrift or Protobuf
over HTTP/gRPC, use the collector_endpoint parameter:
tracing:
  exporter_type: jaeger
  sample_rate: 1.0
  jaeger:
    collector_endpoint: http://localhost:14268/api/traces?format=jaeger.thrift
tracing:
  exporter_type: jaeger
  sample_rate: 1.0
  jaeger:
    collector_endpoint: http://localhost:14250
Configuration fields are passed through the OpenTelemetry Zipkin exporter [3].
tracing:
  exporter_type: jaeger
  sample_rate: 1.0
  jaeger:
    protocol: thrift
    thrift:
      agent_host_name: localhost
      agent_port: 6831
      udp_split_oversized_batches: true
Note
if udp_split_oversized_batches [5] is
True, the oversized batch will be split into smaller batch over the UDP max
packets size (default: 65000) if given buffer is larger than max
packet size:
tracing:
  exporter_type: jaeger
  sample_rate: 1.0
  jaeger:
    protocol: grpc
    grpc:
      endpoint: http://localhost:14250
      insecure: true  # Whether or not collector has encryption or authentication.
OTLP Exporter#
BentoML supports OTLP exporter for easy integration with an OpenTelemetry Traces receiver. OTLP provides both a gRPC and HTTP protocol that uses Protobuf to send traces. You may use either HTTP or gRPC as protocol. By default, gRPC is the default protocol.
Note
You may also use HTTP protocol as it provides an easier way to configure proxy and load balancer.
To change the protocol, use the protocol parameter:
tracing:
  exporter_type: otlp
  sample_rate: 1.0
  otlp:
    protocol: http
Configuration fields are passed through the OpenTelemetry Zipkin exporter [6].
Note
Make sure to set endpoint to have traces export path /v1/traces appended.
tracing:
  exporter_type: otlp
  sample_rate: 1.0
  otlp:
    protocol: http
    endpoint: http://localhost:4318/v1/traces
    http:
      certificate_file: /path/to/cert.pem
      headers:
        Keep-Alive: timeout=5, max=1000
tracing:
  exporter_type: otlp
  sample_rate: 1.0
  otlp:
    protocol: grpc
    endpoint: http://localhost:4317
    grpc:
      insecure: true
      headers:
        - ["grpc-encoding", "gzip"]
Notes