Metrics#
time expected: 6 minutes
Metrics are measurements of statistics about your service, which can provide information about the usage and performance of your bentos in production.
BentoML allows users to define custom metrics with Prometheus to easily enable monitoring for their Bentos.
This article will dive into the default metrics and how to add custom metrics for either a Custom Runner or Service.
Having a Prometheus server available will help visualize the examples in this guide.
Note
This article assumes that you have a base understanding of a BentoService. If you are new to BentoML, please start with the quickstart tutorial.
See also
All metrics types supported by Prometheus are supported in BentoML. See Metrics API for more information on bentoml.metrics.
Default Metrics#
BentoML automatically collects the following metrics for all API Server and Runners by default across the following dimensions.
Description |
Metric Name |
Metric Type |
Dimensions |
|---|---|---|---|
API Server request in progress |
|
Gauge |
|
Runner request in progress |
|
Gauge |
|
API Server request total |
|
Counter |
|
Runner request total |
|
Counter |
|
API Server request duration in seconds |
|
Histogram |
|
Runner request duration in seconds |
|
Histogram |
|
Runner adaptive batch size |
|
Histogram |
|
Request In-Progress#
Measures the number of requests currently being processed by the API Server or Runner.
Request Total#
Measures the total number of requests processed by the API Server or Runner. The following PromQL expression returns the average request count
per-second over the last 1 minute for the /classify endpoint on the iris_classifier service.
rate(bentoml_api_server_request_total{service_name="iris_classifier", endpoint="/classify"}[1m])
Request Duration#
Measures the durations of requests processed by the API Server or Runner. The accuracy of the histogram depends on the range and
granularity of the histogram buckets. By default, the Prometheus buckets covering the range from 0.005s to 10s are used. The following
configuration can be used to update the buckets configuration for the request duration metric. The configuration keys min and max indicates
the expected range of request duration to be tracked. The configuration key factor controls the granularity of the buckets and is used as
the exponential factor to generate the buckets. For example, the configuration below will generate the following buckets
(0.1, 0.2, 0.4, 0.8, 1.6, 3.2, 5.0, inf). See the configuration guide for more information on
how to configure BentoML.
api_server:
  metrics:
    duration:
      min: 0.1
      max: 5.0
      factor: 2.0
The following PromQL expression returns the 99th percentile of the request duration over the last 1 minute for the /classify endpoint
on the iris_classifier service.
histogram_quantile(0.99, rate(bentoml_api_server_request_duration_seconds_bucket{service_name="iris_classifier", endpoint="/classify"}[1m]))
Adaptive Batch Size#
Measures the batch size used by the adaptive batching feature in the runner.
The following PromQL expression returns the 75th percentile of the batch size over the last 1 minute for the iris_classifier service.
histogram_quantile(0.75, rate(bentoml_runner_adaptive_batch_size_bucket{service_name="iris_classifier"}[1m]))
Custom Metrics#
We will build a custom histogram to track the latency of our pretrained NLTK runner, a custom counter to measure the total amount of time our endpoint is invoked.
Note
The source code for this custom runner is available on GitHub.
Initialize our metrics as follow:
from __future__ import annotations

import bentoml

inference_duration = bentoml.metrics.Histogram(
    name="inference_duration",
    documentation="Duration of inference",
    labelnames=["nltk_version", "sentiment_cls"],
    buckets=(
        0.005,
        0.01,
        0.025,
        0.05,
        0.075,
        0.1,
        0.25,
        0.5,
        0.75,
        1.0,
        2.5,
        5.0,
        7.5,
        10.0,
        float("inf"),
    ),
)

polarity_counter = bentoml.metrics.Counter(
    name="polarity_total",
    documentation="Count total number of analysis by polarity scores",
    labelnames=["polarity"],
)
inference_duration is a bentoml.metrics.Histogram(), which tracks how long it
takes for our model to run inference.
The bentoml.metrics.Histogram.buckets argument is used to determine the granularity of histogram tracking. The range of the buckets should cover the range of values the histogram is expected track. Number of buckets is positively correlated to the the granularity of tracking. The last value of the bucket should always be the positive infinity. See Prometheus documentation on Histogram for more details.
polarity_counter is a bentoml.metrics.Counter(), which tracks the total number
of analysis by the polarity scores.
Note: This also applies to any other metric type, including
bentoml.metrics.Gauge()andbentoml.metrics.Summary().
Create our NLTK custom runner:
class NLTKSentimentAnalysisRunnable(bentoml.Runnable):
    SUPPORTED_RESOURCES = ("cpu",)
    SUPPORTS_CPU_MULTI_THREADING = False

    def __init__(self):
        self.sia = SentimentIntensityAnalyzer()

    @bentoml.Runnable.method(batchable=False)
    def is_positive(self, input_text: str) -> bool:
        start = time.perf_counter()
        scores = [
            self.sia.polarity_scores(sentence)["compound"]
            for sentence in nltk.sent_tokenize(input_text)
        ]
        inference_duration.labels(
            nltk_version=nltk.__version__, sentiment_cls=self.sia.__class__.__name__
        ).observe(time.perf_counter() - start)
        return mean(scores) > 0
This runnable implementation creates a custom NLTK runner, that use the inference_duration
histogram to track the latency of polarity scores from a given sentence.
Initialize our NLTK runner, and add it to the service:
nltk_runner = t.cast(
   "RunnerImpl", bentoml.Runner(NLTKSentimentAnalysisRunnable, name="nltk_sentiment")
)

svc = bentoml.Service("sentiment_analyzer", runners=[nltk_runner])


@svc.api(input=bentoml.io.Text(), output=bentoml.io.JSON())
async def analysis(input_text: str) -> dict[str, bool]:
    is_positive = await nltk_runner.is_positive.async_run(input_text)
    polarity_counter.labels(polarity=is_positive).inc()
    return {"is_positive": is_positive}
Our endpoint analysis uses the polarity_counter to track the total number of
invocation for analysis by polarity scores.
Serve our service:
» bentoml serve-http
Use the following prometheus.yml config:
global:
  scrape_interval: 5s
  evaluation_interval: 15s

scrape_configs:
  - job_name: prometheus
    metrics_path: "/metrics"
    static_configs:
      - targets: ["0.0.0.0:3000"]
Startup your Prometheus server in a different terminal session:
» prometheus --config.file=prometheus.yml
In a different terminal, send a request to our service:
» curl -X POST -F "image=@test_image.png" \
         http://0.0.0.0:3000/predict
Serve our service:
» bentoml serve-grpc --enable-reflection
Use the following prometheus.yml config:
global:
  scrape_interval: 5s
  evaluation_interval: 15s

scrape_configs:
  - job_name: prometheus
    metrics_path: "/"
    static_configs:
      - targets: ["0.0.0.0:3001"]
Startup your Prometheus server in a different terminal session:
» prometheus --config.file=prometheus.yml
In a different terminal, send a request to our service:
» grpcurl -d @ -plaintext 0.0.0.0:3000 bentoml.grpc.v1.BentoService/Call <<EOT
  {
    "apiName": "predict",
    "serializedBytes": "..."
  }
  EOT
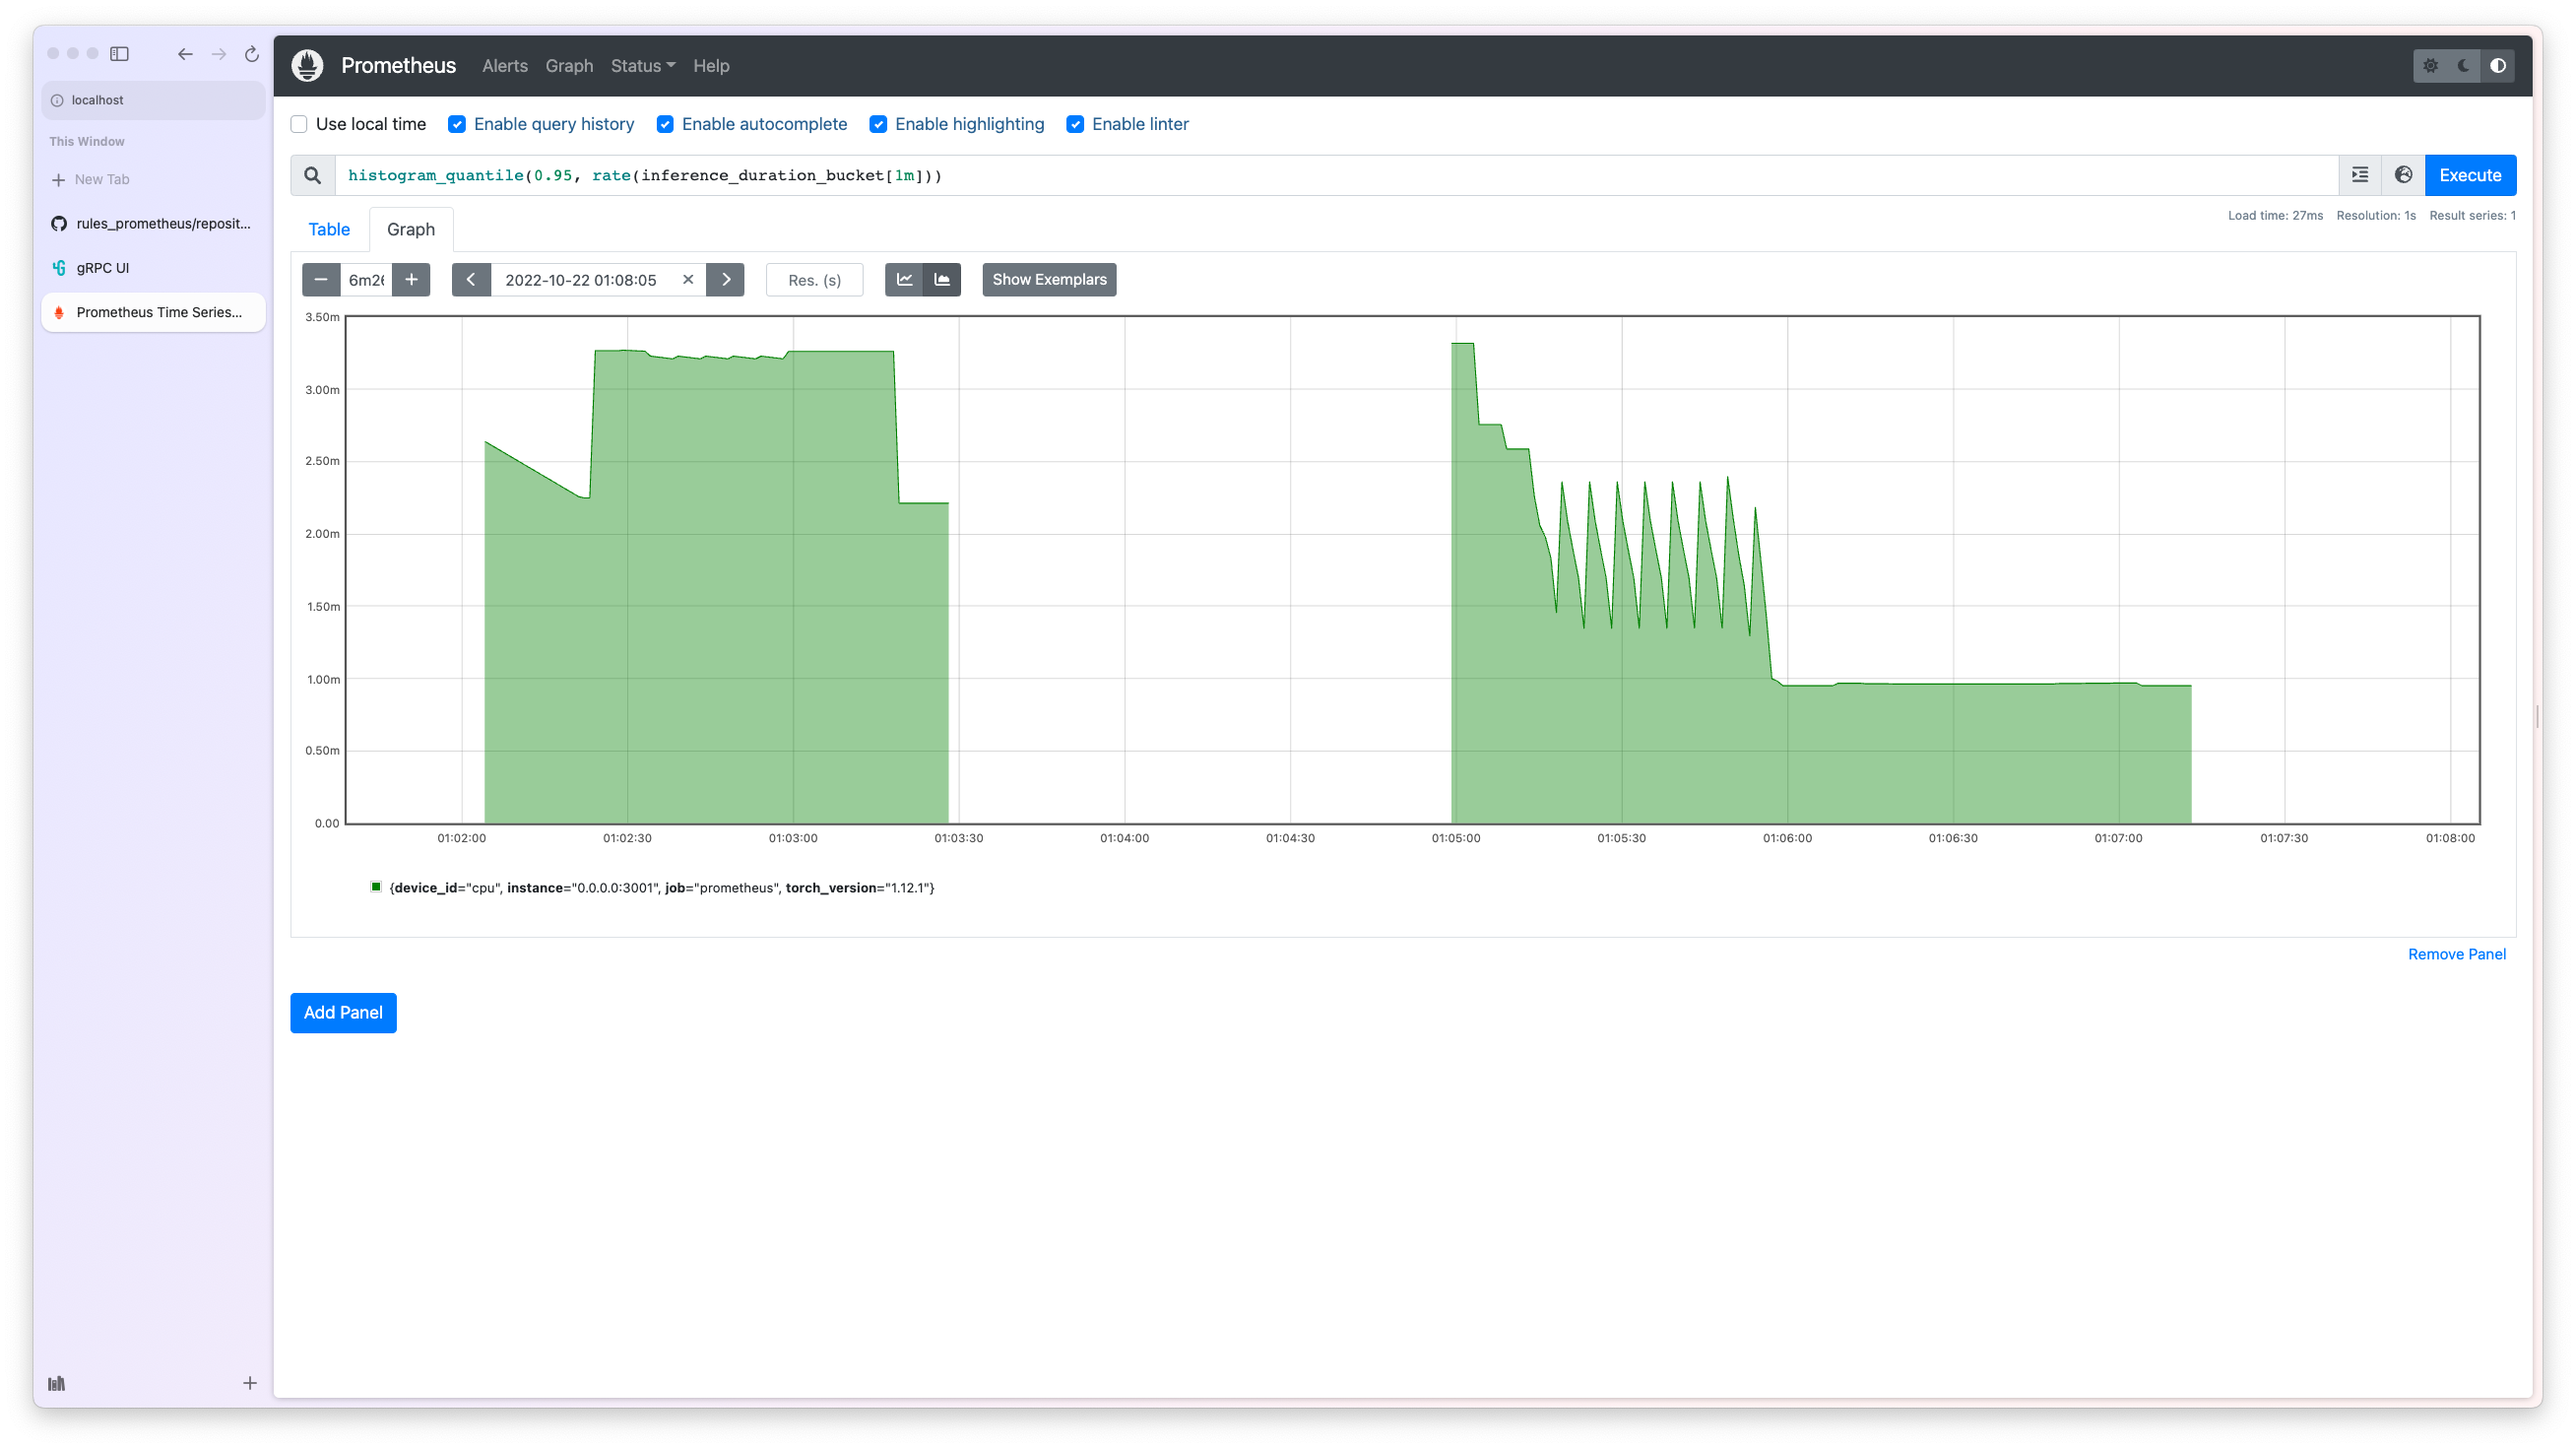
Visit http://localhost:9090/graph and use the following query for 95th percentile inference latency:
histogram_quantile(0.95, rate(inference_duration_bucket[1m]))
Todo
Grafana dashboard
Help us improve the project!
Found an issue or a TODO item? You’re always welcome to make contributions to the project and its documentation. Check out the BentoML development guide and documentation guide to get started.